
May 20, 2025 — Bitcoin has hit a bump just shy of its all-time high, triggering renewed debate over whether the world’s largest cryptocurrency is poised for another leg upward or preparing for a deeper pullback. While traditional chart patterns and short-term technical hint at potential turbulence, on-chain metrics tell a different story—one that may offer investors a reason for optimism.
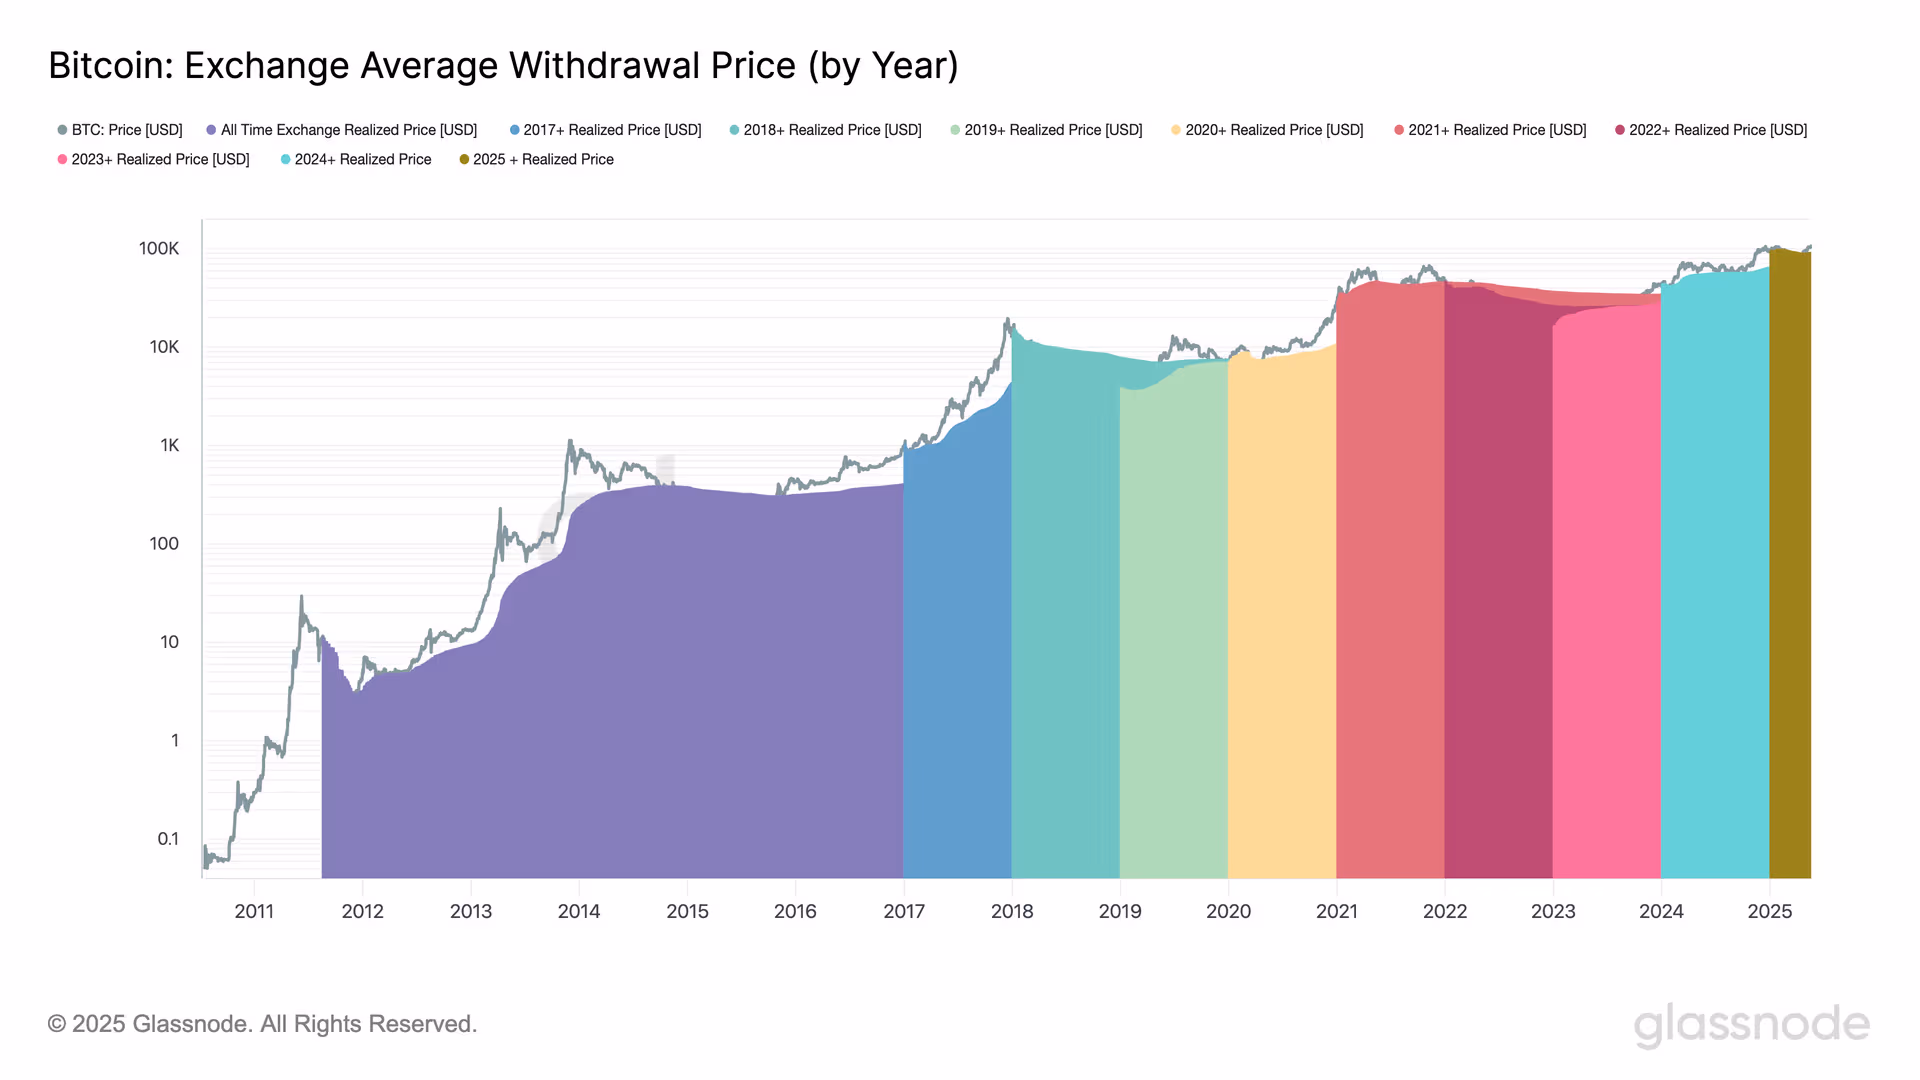
At the center of this bullish interpretation is the concept of Bitcoin’s “realized price,” an important on-chain indicator that reflects the average price at which all existing bitcoins last moved. Unlike market price, which reacts to sentiment and short-term volatility, realized price gives insight into the behavior of long-term holders and the underlying health of the network.
As of this week, Bitcoin’s realized price sits significantly below its current trading level—suggesting that a large majority of holders remain in profit. More importantly, historical data shows that when the market price remains well above the realized price for extended periods, it often signals the start of strong bull market conditions.
Current Market Snapshot
Bitcoin is currently trading around $68,500, down slightly from its recent attempt to breach the $70,000 level. This marks a hesitation just beneath the record high of approximately $73,800 set earlier this year. Analysts have attributed the pause to a mix of macroeconomic uncertainty, profit-taking, and cautious investor sentiment ahead of upcoming regulatory announcements in the U.S. and Europe.
Yet beneath the surface, network fundamentals remain robust. Hash rate, wallet activity, and long-term holder supply are all near historic highs. And most notably, the realized price—currently hovering near $24,500—continues to trend upward, reflecting increased conviction among holders who bought during previous bear markets and have yet to sell.
Realized Price as a Bull Market Signal
Historically, when Bitcoin’s market price exceeds the realized price by a significant margin for a sustained period, it tends to confirm the onset of a bullish cycle. This trend was evident in previous cycles, including the rallies in 2013, 2017, and 2021. In each case, a significant divergence between market and realized prices was accompanied by increased capital inflows, rising institutional interest, and growing retail engagement.
Today’s divergence is similarly notable. With the realized price more than 60% below current market levels, the data implies that the average investor remains in profit and is potentially less likely to sell during short-term dips. This dynamic reduces sell pressure and can help sustain bullish momentum.
Cautious Optimism Ahead
While Bitcoin may face headwinds in the short term—especially with regulatory and macroeconomic variables in play—the realized price metric offers a longer-term view that many investors find reassuring. Combined with increasing on-chain accumulation, low exchange balances, and rising interest from traditional financial institutions, there’s a growing sense that Bitcoin’s foundation is stronger than it appears during brief corrections.
Analysts urge caution, but also encourage investors to consider the broader on-chain picture. As Bitcoin consolidates near record highs, it’s the behavior of long-term holders and the strength of network fundamentals that could ultimately determine whether the next breakout is just around the corner.
Conclusion
Bitcoin’s inability to decisively break past its all-time high may appear discouraging on the surface, but deeper metrics like realized price point to enduring strength beneath the volatility. For seasoned crypto watchers, this divergence between price and fundamentals is not a warning—it’s an opportunity.
 Bitcoin
  Ethereum
  XRP
XRP  Tether
  BNB
BNB  Solana
  USDC
USDC  Dogecoin
  Cardano
  Wrapped stETH
  Hyperliquid
  Wrapped Bitcoin
  Sui
Sui  Ethena USDe
  Stellar
  Figure Heloc
  Avalanche
  Wrapped eETH
  Bitcoin Cash
  WETH
WETH  Hedera
  Litecoin
  LEO Token
  Shiba Inu
  Toncoin
  USDS
USDS  Coinbase Wrapped BTC
  Polkadot
  Binance Bridged USDT (BNB Smart Chain)
  WhiteBIT Coin
  Ethena Staked USDe
  World Liberty Financial
  Ethena
  Pepe
Pepe  Aave
Aave  OKB
OKB  MemeCore
  Jito Staked SOL
  NEAR Protocol
  Bittensor
  Ondo
Ondo  Worldcoin
  Aptos
Aptos  Story
Story  Pi Network
  POL (ex-MATIC)
  Binance Staked SOL
  Arbitrum
  USDT0
USDT0  Binance-Peg WETH
  USD1
USD1  Pump.fun
  MYX Finance
  Pudgy Penguins
  Cosmos Hub
  Algorand
  BlackRock USD Institutional Digital Liquidity Fund
  Jupiter Perpetuals Liquidity Provider Token
  VeChain
  Kinetiq Staked HYPE
  Rocket Pool ETH
  Render
  Gate
Gate  KuCoin
  sUSDS
sUSDS  Bonk
Bonk  Fasttoken
  Official Trump
  USDtb
USDtb  Filecoin
  Artificial Superintelligence Alliance
  StakeWise Staked ETH
  Falcon USD
  Sky
Sky  Flare
Flare  BFUSD
BFUSD  Jupiter
  Liquid Staked ETH
  Quant
Quant  Optimism
  Polygon Bridged USDT (Polygon)
  Celestia
  Injective
  Tether Gold
  Jupiter Staked SOL
  SPX6900
  Mantle Staked Ether
  Immutable
  NEXO
NEXO  Solv Protocol BTC
  Curve DAO
  Lido DAO
  Aerodrome Finance
  syrupUSDC
  Marinade Staked SOL
  The Graph
  PAX Gold
  Binance Bridged USDC (BNB Smart Chain)
  Super OETH
  FLOKI
FLOKI  Four
Four  Pyth Network
  Arbitrum Bridged WBTC (Arbitrum One)
  dogwifhat
  Kaia
Kaia  Raydium
  Conflux
  Fartcoin
  cgETH Hashkey Cloud
  clBTC
clBTC  Virtuals Protocol
  GALA
GALA  L2 Standard Bridged WETH (Base)
  Zcash
Zcash  Ethereum Name Service
  IOTA
IOTA  Jito
Jito  Binance-Peg Dogecoin
  JasmyCoin
  Ripple USD
  OUSG
OUSG  Decentraland
  Stader ETHx
  Ether.fi
  ether.fi Staked ETH
  Flow
Flow  tBTC
tBTC  Stables Labs USDX
  Ondo US Dollar Yield
  Arbitrum Bridged WETH (Arbitrum One)
  Aethir
  AB
AB  Coinbase Wrapped Staked ETH
  Mantle Restaked ETH
  Swell Ethereum
  Beldex
  Global Dollar
  Loaded Lions
  Usual USD
  Starknet
  EigenCloud (prev. EigenLayer)
  Brett
Brett  Avalanche Bridged BTC (Avalanche)
  Bitcoin SV
  BUILDon
  dYdX
dYdX  BENQI Liquid Staked AVAX
  Polygon PoS Bridged WETH (Polygon POS)
  Bybit Staked SOL
  ApeCoin
  TrueUSD
  USDD
USDD  Arweave
  Telcoin
  NEO
NEO  Reserve Rights
  Core
Core  Keeta
Keeta  Superstate Short Duration U.S. Government Securities Fund (USTB)
  THORChain